
What candidates actually score on aptitude practice tests
Prep sites publish a single average and leave candidates to guess what it means. A distribution is more useful than a mean, and a decomposition is more useful than either: a raw score is how much of the paper you reached multiplied by how well you did on it, and those two terms are not equally important.
Sample 727 re-graded practice attempts from 575 distinct candidates. 6 forms cleared the thirty-attempt floor for inclusion.
1Finding
on a speeded form, the raw score follows coverage more closely than accuracy
With a generous clock the ordering reverses: 0.77 for accuracy against 0.59 for coverage. Speeded n=533, generous n=184.
Candidates treat a low practice score as evidence that they do not know enough. On a speeded form that reading is usually wrong. The average attempt answers 72% of what it attempts correctly and reaches only 80% of the paper. The missing marks are overwhelmingly on questions that were never seen, not questions that were got wrong.
Where the clock is generous, the pattern inverts. Coverage rises to 96.1% and stops discriminating, so the score goes back to measuring what people assume it measures. Two tests that look alike on paper can be scoring two different things.
2Where practising candidates land
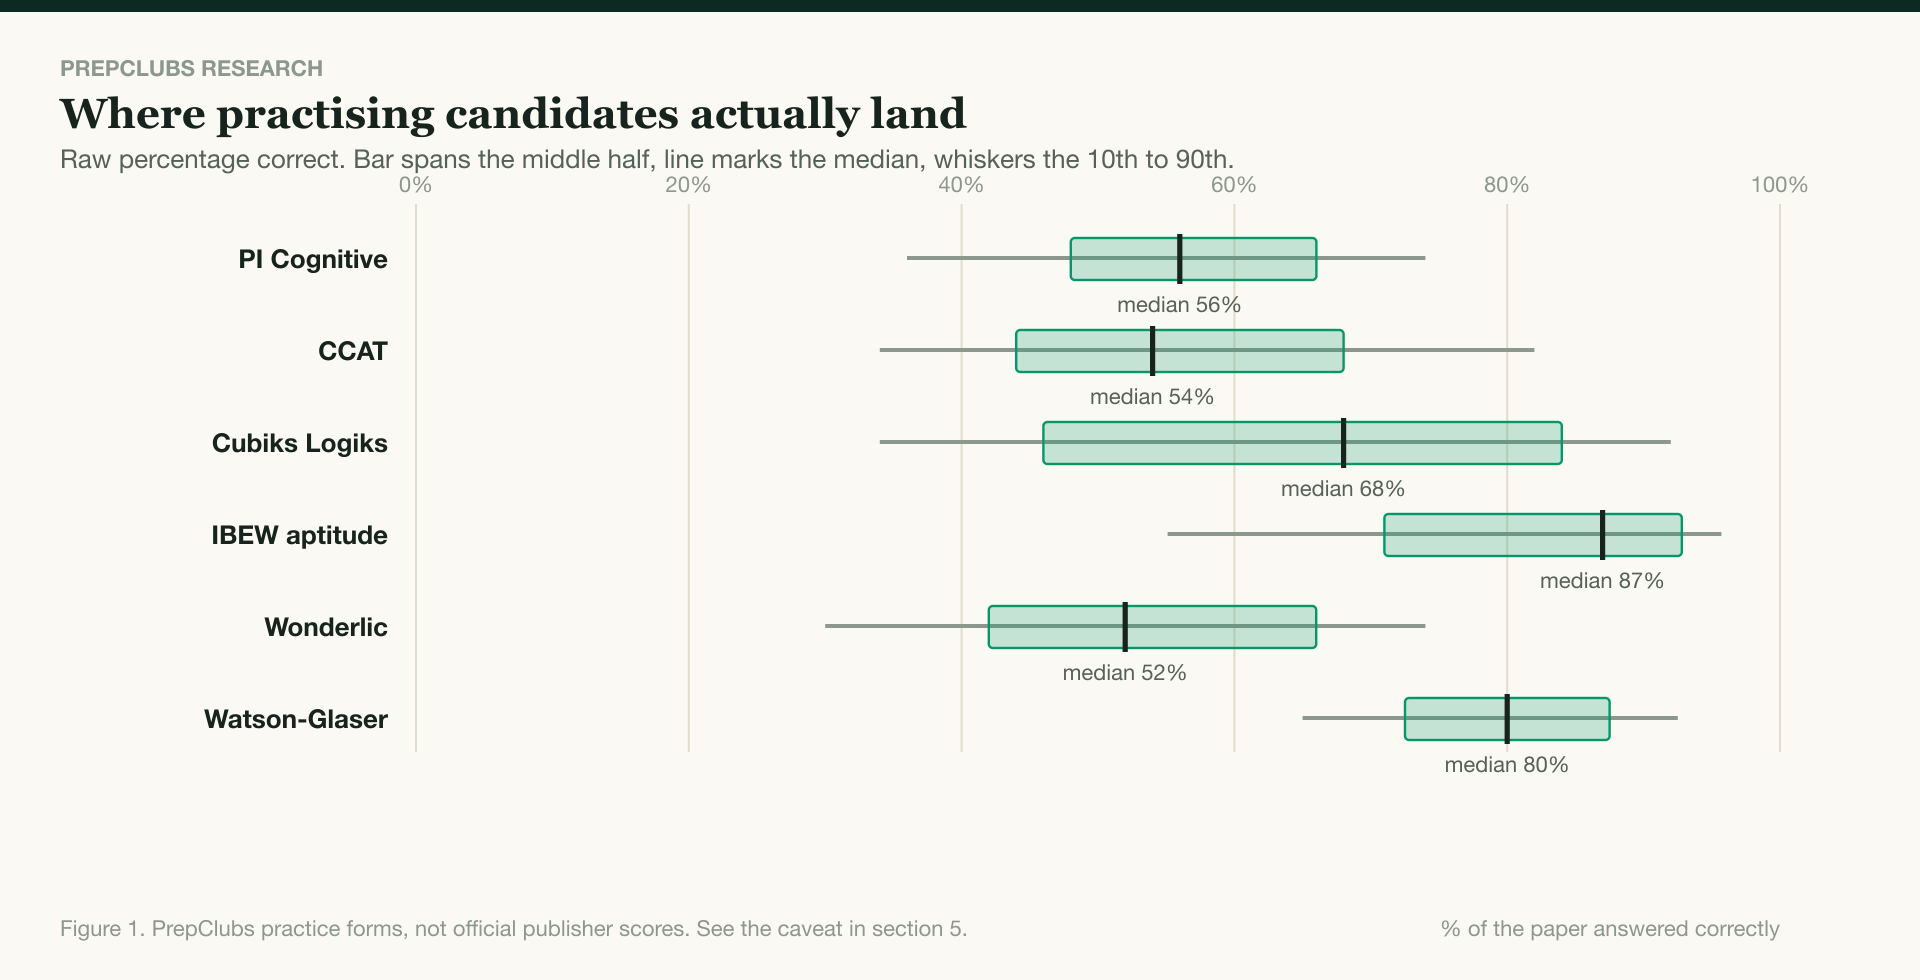
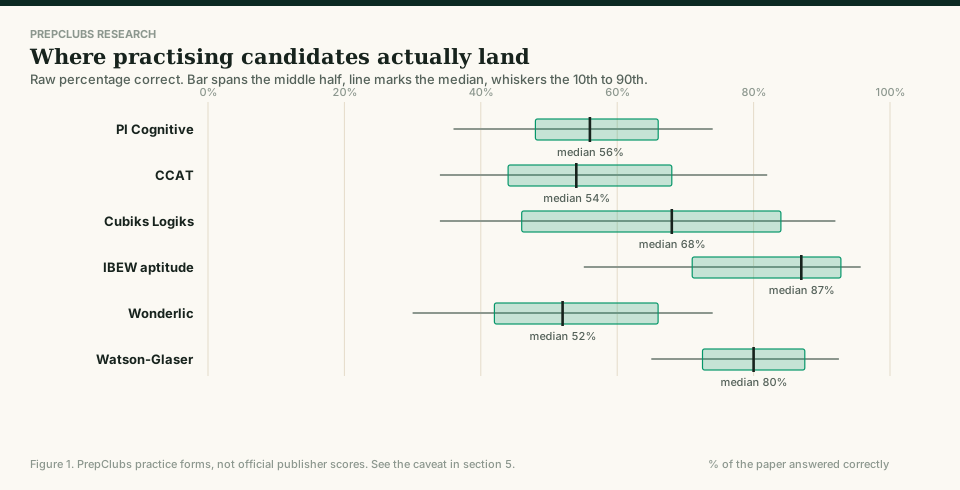
| Form | Attempts | Items | 10th | 25th | Median | 75th | 90th | Mean |
|---|---|---|---|---|---|---|---|---|
| PI Cognitive | 215 | 50 | 36% | 48% | 56% | 66% | 74% | 56.6% |
| CCAT | 189 | 50 | 34% | 44% | 54% | 68% | 82% | 55.9% |
| Cubiks Logiks | 76 | 50 | 34% | 46% | 68% | 84% | 92% | 64.4% |
| IBEW aptitude | 61 | 69 | 55.1% | 71% | 87% | 92.8% | 95.7% | 79.5% |
| Wonderlic | 53 | 50 | 30% | 42% | 52% | 66% | 74% | 54.3% |
| Watson-Glaser | 41 | 40 | 65% | 72.5% | 80% | 87.5% | 92.5% | 79.8% |
Percentage of all items on the paper answered correctly. Unanswered items count as incorrect, which is how every one of these tests scores them.
The spread is the story, not the median. On the Cubiks Logiks form the tenth and ninetieth percentiles are 58 points apart; on the Watson-Glaser form they are 27.5 apart. A test that spreads candidates widely is one where preparation has room to move a result. A test that bunches them is one where it has less.
3What a raw score is made of
Every raw score decomposes exactly: the share of the paper reached, multiplied by the share of what was reached that was answered correctly. Correlating each term against the score says which one is doing the work.
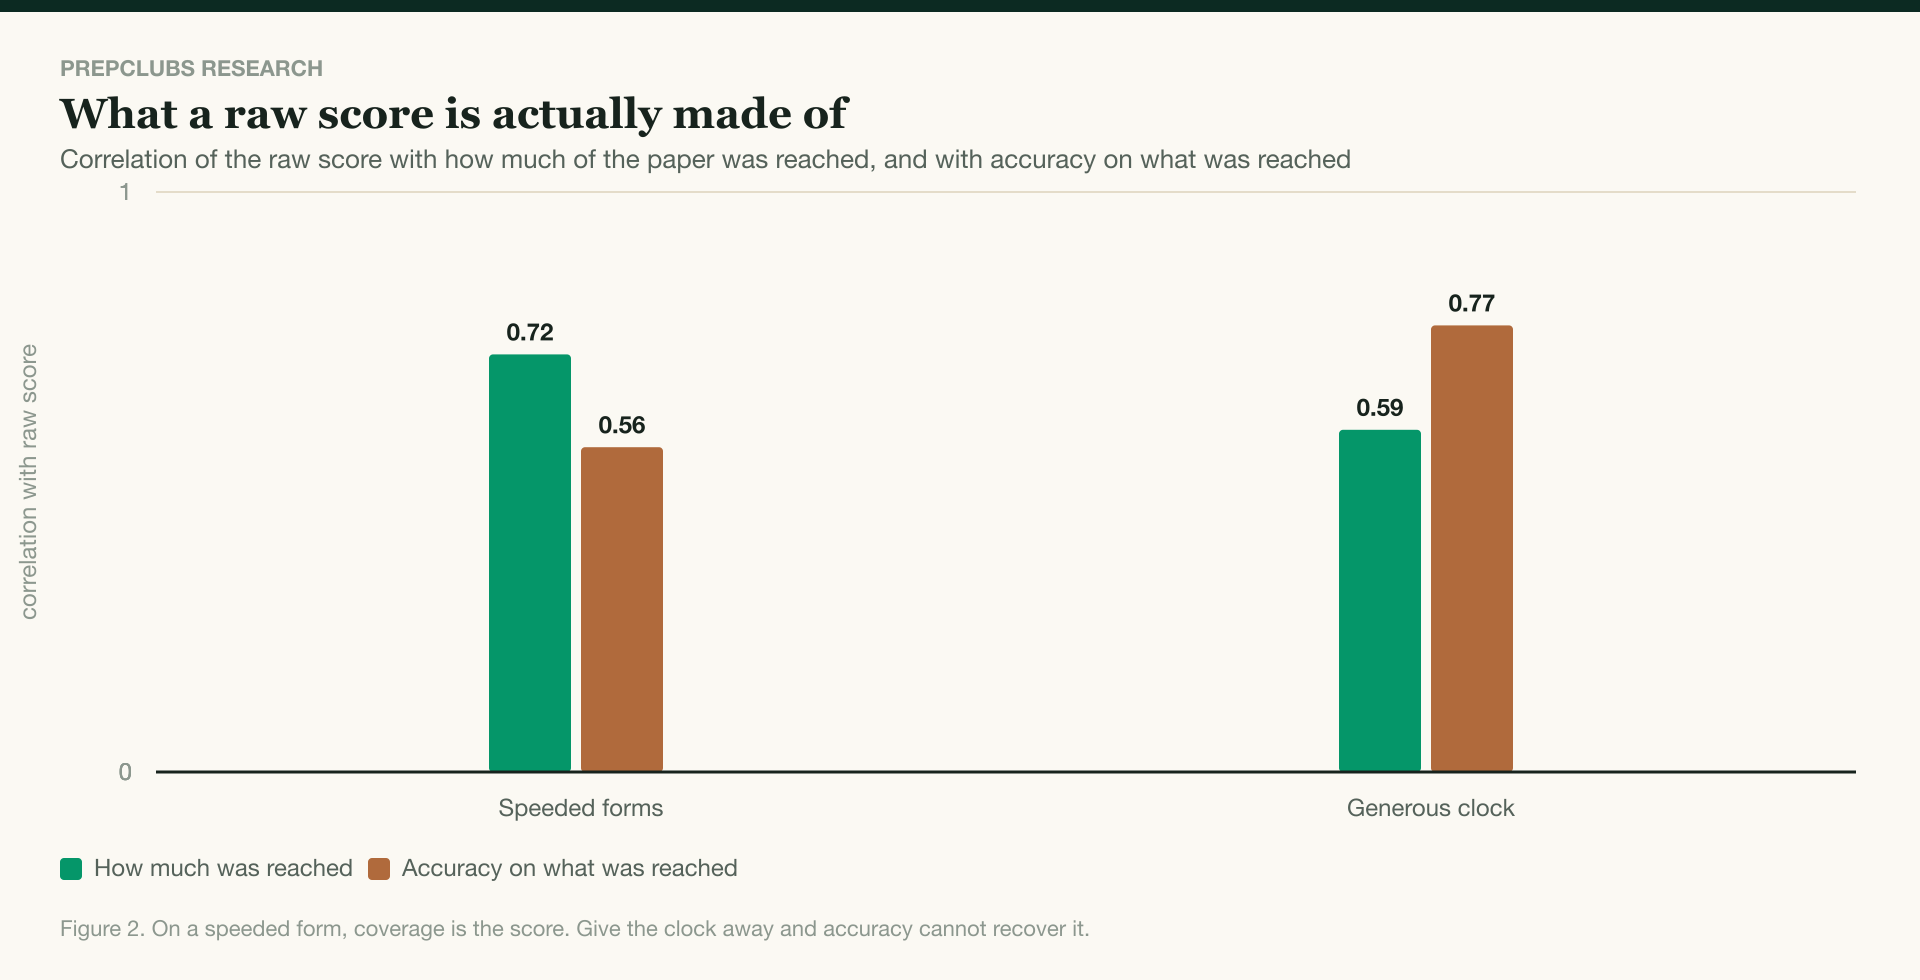
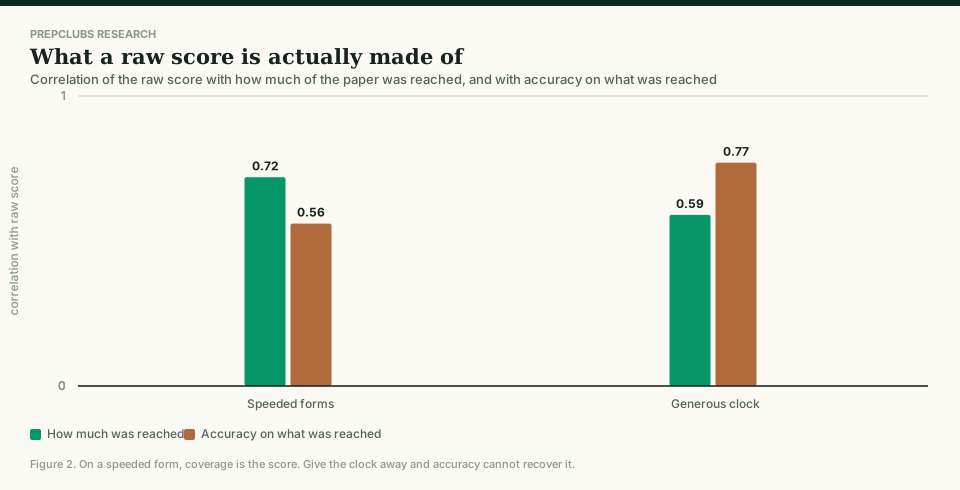
| Population | Attempts | Reached | Accuracy on that | r with coverage | r with accuracy |
|---|---|---|---|---|---|
| Speeded forms | 533 | 80% | 72% | 0.72 | 0.56 |
| Generous clock | 184 | 96.1% | 82.1% | 0.59 | 0.77 |
Pearson correlation between the raw score and each of its two components, computed across attempts.
The practical reading is blunt. On a speeded form, the single most efficient thing most candidates can do to their score is finish the paper. Report 2026-01 shows they do not, Report 2026-02 shows where the time goes, and this is what it costs in marks.
4Reading your own result
- Check coverage first. If you reached under eighty percent of a speeded paper, the score is measuring your pace and not your reasoning.
- Compare against the right form. A 54% on a CCAT-format paper is the median; the same figure on an IBEW paper sits below the tenth percentile. Comparing a score across formats is meaningless.
- Treat a single attempt as one draw. The bands here are distributions across candidates, not a measurement of any candidate. One attempt anywhere inside the middle half is consistent with a wide range of underlying ability.
- Do not convert these to a percentile you will be judged on. They describe people practising on this platform, which is not the publisher’s norming group and not your employer’s applicant pool.
5What these numbers are not
These are raw percentages correct on PrepClubs practice forms, not official scores from Criteria, Wonderlic, Predictive Index, Cubiks, Watson-Glaser or any other publisher, and they are not scaled, normed or mapped to any employer's cut score. Our forms are written to the published format of each test; they are not the test. Read the distribution as where practising candidates sit against each other, not as a prediction of a result on the day.
- Not official scores. These are raw percentages on PrepClubs forms written to each test’s published format. They are not issued by, endorsed by or scaled against Criteria Corp, Wonderlic, Predictive Index, Cubiks, TalentLens or any other publisher.
- Not a norming group. People practising for a test are self-selected: they knew the test was coming and chose to prepare. That is not a random sample of applicants.
- Not stakes-matched. A practice attempt at home and an assessment attached to a job offer are different events, and nothing here measures the difference.
- Correlation, not cause. Section 3 reports how the score moves with each of its components. It does not establish that raising coverage on a given candidate raises their score by the amount implied.
6Sample, filters and discards
Every form with at least 30 analysed attempts. The corpus and its filters are shared with every other report in this series.
| Attempts on record | 1,473 |
| Discarded: re-grade disagreed with the stored score | 556 |
| Discarded: no answers recorded | 26 |
| Discarded: used under half the allowed clock | 164 |
| Analysed | 727 |
| Distinct candidates behind those attempts | 575 |
7The forms this report is computed from
Compare your own attempt against the right band: a score is only meaningful against the format it was sat on.
- PI Cognitive Assessment
Median 56%, middle half 48% to 66%, across 215 analysed attempts. Candidates reach 81.3% of the paper.
- CCAT
Median 54%, middle half 44% to 68%, across 189 analysed attempts. Candidates reach 79.4% of the paper.
- Cubiks Logiks
Median 68%, middle half 46% to 84%, across 76 analysed attempts. Candidates reach 78.1% of the paper.
- IBEW aptitude test
Median 87%, middle half 71% to 92.8%, across 61 analysed attempts. Candidates reach 92.4% of the paper.
- Wonderlic
Median 52%, middle half 42% to 66%, across 53 analysed attempts. Candidates reach 80% of the paper.
- Watson-Glaser
Median 80%, middle half 72.5% to 87.5%, across 41 analysed attempts. Candidates reach 99.6% of the paper.
8Common questions
- What is an average score on a CCAT practice test?
- On PrepClubs CCAT-format forms, the median attempt answers 54% of the paper correctly, which on a fifty-question form is 27 items. The middle half of attempts falls between 44% and 68%, and the tenth to ninetieth percentile spans 34% to 82%. These are practice scores on our own forms, not scaled scores from Criteria.
- Why are Watson-Glaser and IBEW scores so much higher?
- Because the clock is not binding on them. Candidates reach 99.6% of the Watson-Glaser paper and 92.4% of the IBEW paper, against 79.4% of the CCAT paper. A generous clock converts almost the whole paper into scorable attempts, and the median rises accordingly. It is not evidence that those tests are easier in any deeper sense.
- Should I worry about a low first practice score?
- Look at the coverage before you look at the score. On speeded forms the raw score tracks how much of the paper was reached (r=0.72) more closely than accuracy on what was reached (r=0.56). A candidate answering 72% of what they attempt but only reaching 80% of the paper has a pacing problem, and pacing is the more improvable of the two.
- Do these percentiles map to a real employer cut score?
- No, and no honest source could give you that mapping. Publishers scale and norm their own instruments against their own reference groups, employers set their own thresholds, and neither is public. What these bands tell you is where you sit among people practising for the same test, which is the comparison actually available to you.
Suggested citation
“The median practice attempt answers 54% of a CCAT-format paper correctly and 52% of a Wonderlic-format paper, with the middle half of candidates spread across 44% to 68% on the CCAT form. On speeded forms a raw score correlates more strongly with how much of the paper was reached (r=0.72) than with accuracy on what was reached (r=0.56); with a generous clock that ordering reverses. PrepClubs Research, Report 2026-04.”
Download the figures as CSVMethod and standardsAsk us to check a figure
Reproduce any figure or table with attribution to PrepClubs Research and a link to this page. The underlying per-question records are not published: joined to an attempt they are re-identifiable at this sample size.
Other reports in this series
- PCR-2026: The State of Timed Assessment 2026
Every finding of the year in one document.
- 2026-01: How much of a timed aptitude test is never answered
Abandonment by position on speeded and generous-clock forms.
- 2026-02: What an extra thirty seconds on a question actually buys
The return on deliberation, measured inside the same question.
- 2026-03: Which aptitude tests are built as a difficulty ramp
Accuracy by position, with selection controlled out.